Choose values
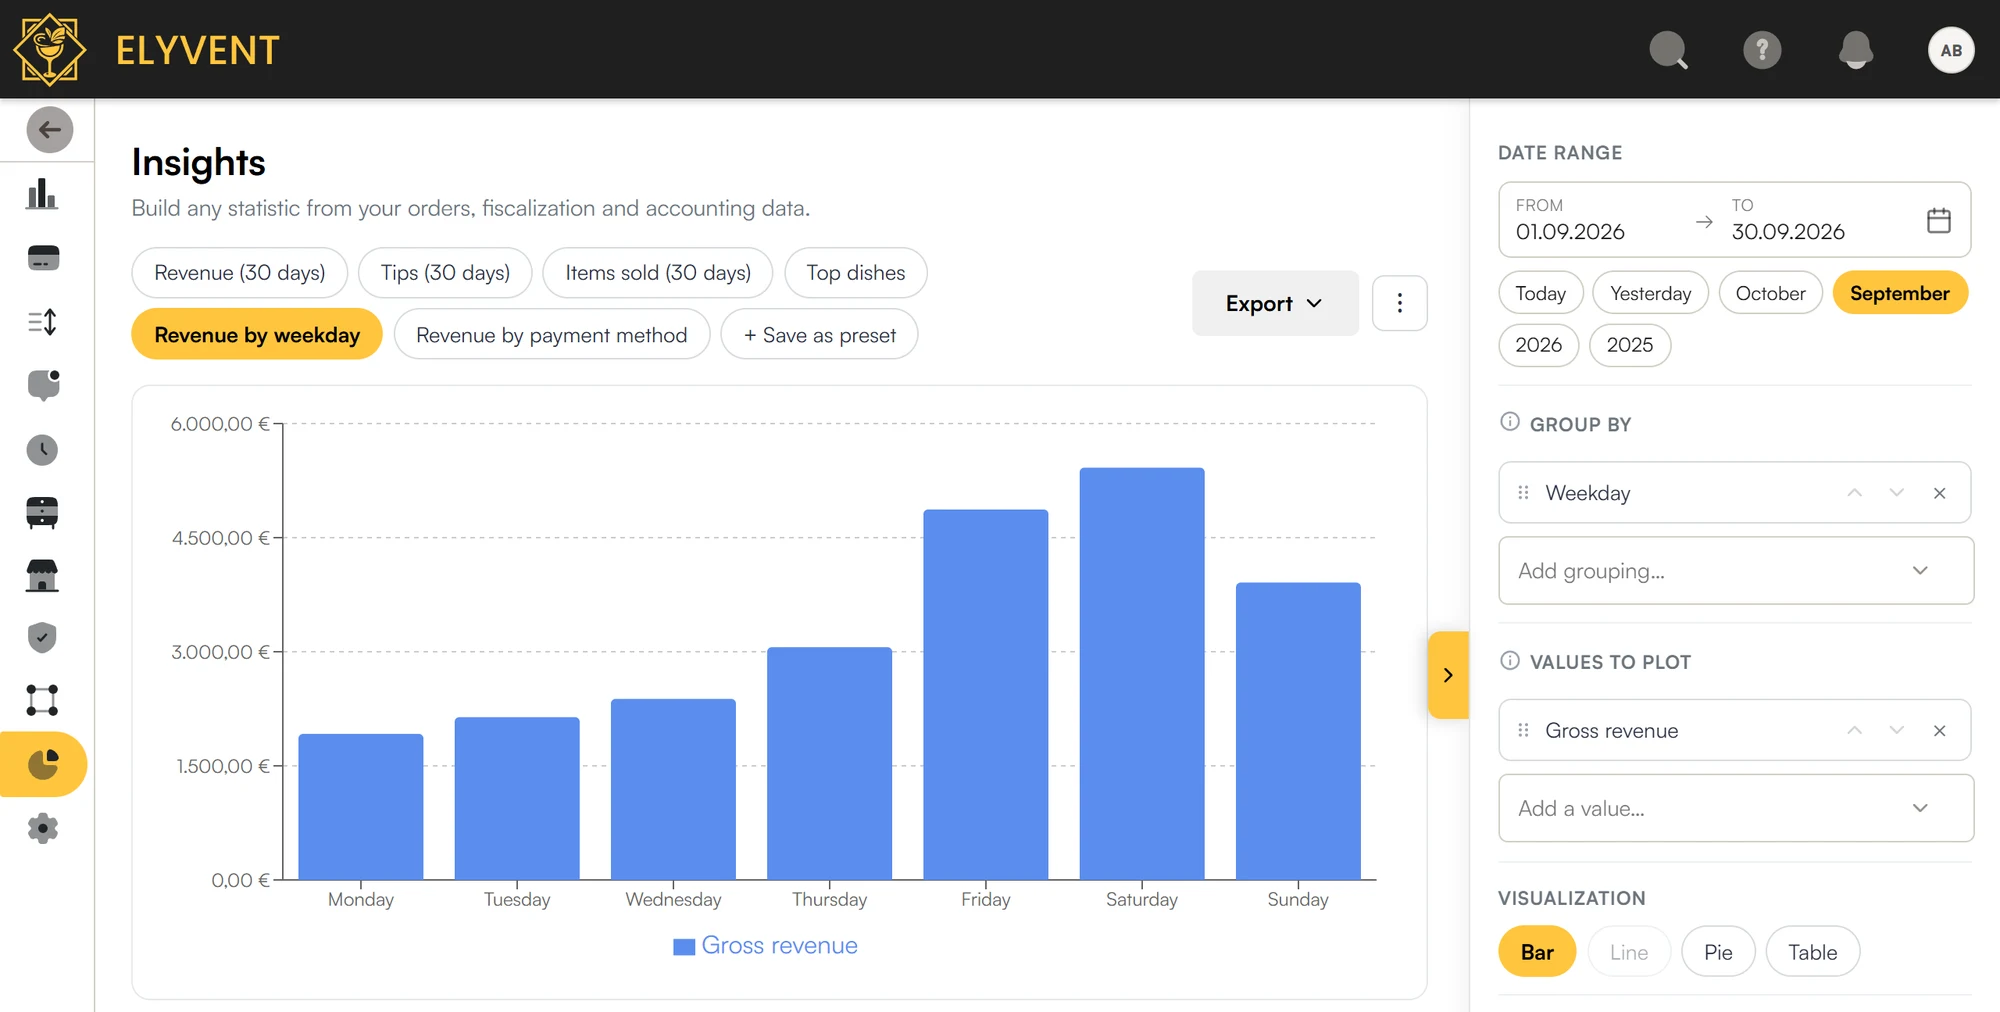
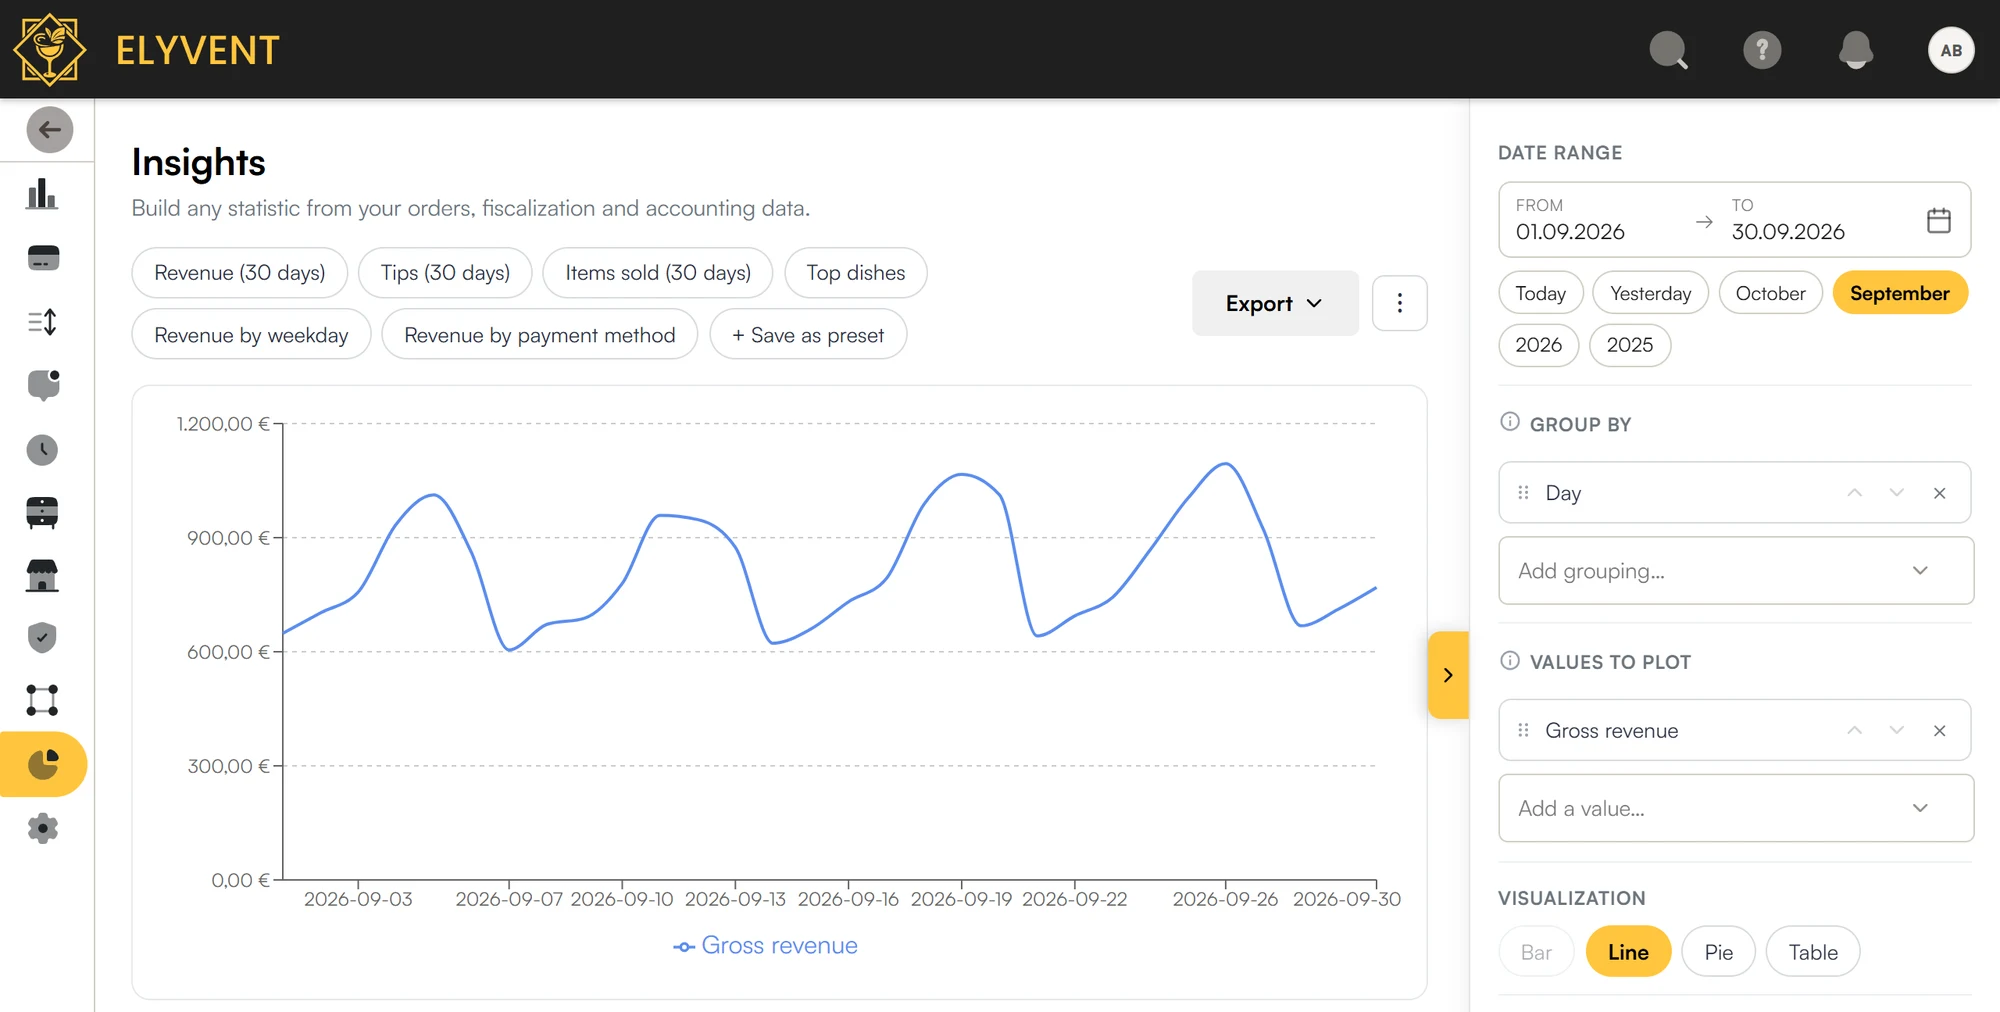
Gross revenue, net revenue, orders, average order value, tips, discounts, tax, refunds, items sold, revenue per item.


Every report you need – in seconds, live from your orders.

How it works
Gross revenue, net revenue, orders, average order value, tips, discounts, tax, refunds, items sold, revenue per item.
Up to six levels: day, week, month, hour, weekday, dish, category, payment method, order type, till, location.
As bar, line, pie or table – and with one click as PDF, image, Excel or CSV.
Live
Elyvent calculates straight from your orders – no waiting for the monthly report. Days and hours follow your restaurant's local time.
For your team
Launch offer: free POS, forever.
Analytics included – for everyone who signs up now.